

Creating clear reports and updating them in real-time requires a powerful information processing service for modern businesses. The BI platform, Power BI is very capable and effective. This product is receiving significant investment from Microsoft, and as a result, updates that increase its functionality are released frequently. These program iterations are highly usable and are becoming very popular in the market.
For Microsoft Windows 10 users, there is a specialized version of Power BI Desktop designed specifically for creating data models and reports. On the other hand, Power BI Service focuses on analyzing pre-made reports with limited options for data manipulation. Typically, the film developed in Power BI Desktop is initially published to the Power BI Service as a construction tool, enabling additional functionalities. This aspect contributes to its reputation as a top-notch BI developer.
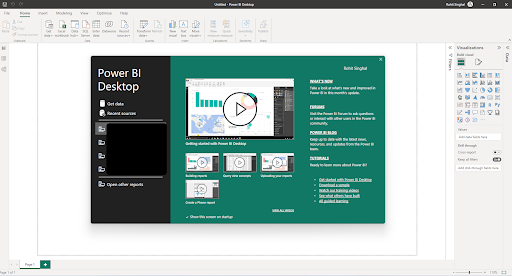
Once Power BI Desktop is installed, launch the application on your local computer. A Power BI tutorial will be presented to you. You can either follow the tutorial to start with a blank canvas or exit the dialogue. The canvas is the platform where you can create data-driven visuals and reports.
Here are the steps: How to Connect to a Data Source in Power BI
Step 1: Launch Power BI
On your computer, launch Power BI to get started. Download it from the official Microsoft website if it isn’t already there. There is a web-based version of Power BI in addition to a desktop application for Windows.
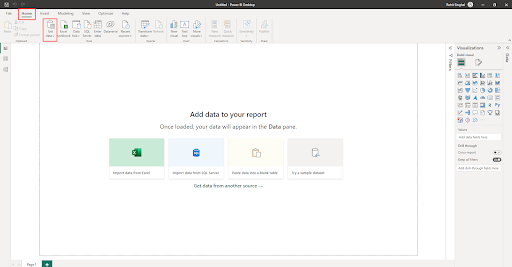
Step 2: Click on “Get Data”
Upon starting Power BI, you will see a home screen with a number of options. The “Get Data” button is visible and is easy to find under Home Tab. To begin the process of connecting your data, click on it.
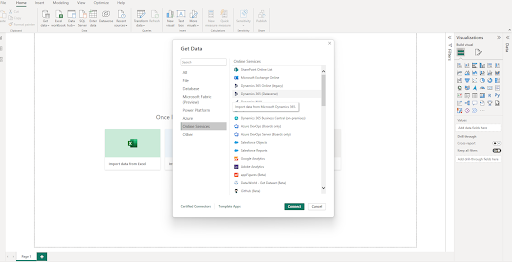
Step 3: Choose a Data Source
Databases, files, online services, and many other types of data sources are available for connection with Power BI. Choose the data source from which the data that you wish to analyze is taken. For instance, you could connect to Excel documents, SQL databases, SharePoint lists, or even online services like Salesforce.
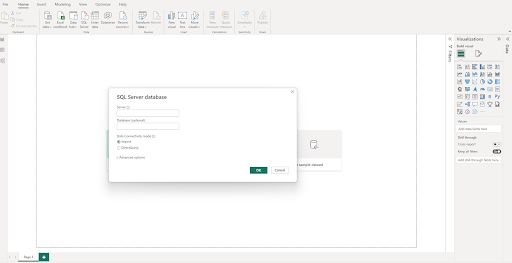
Step 4: Provide Connection Details
You can connect to a variety of different data sources using Power BI Desktop. Basic data sources, such as a Microsoft Excel file, are among these. You may connect to online data providers. You’ll be prompted to enter the required connection information after choosing your data source. Your choice of the data source will determine how this changes. For instance, you will need to provide the server name, database name, and credentials if you are connecting to a SQL database.
Step 5: Transform and Load Data (Optional)
Before importing the data into Power BI, you might want to perform some transformations on it after you’ve established a connection to your data source. Although this step is optional, it can be helpful if the data needs to be cleaned or shaped. You can accomplish this with the aid of a variety of data transformation tools from Power BI.
Step 6: Load Data into Power BI
Click “Load” to import the data into Power BI when you are ready with the data connection and any necessary transformations. You can further refine the data if necessary by loading it into the Power Query Editor.
In that window, you can select which data to put into Power BI Desktop. Mark the checkboxes next to the tables you want to import to choose them. Import both tables that are available.
Step 7: Create visualizations
Your data has now been successfully loaded into Power BI, and you can begin building visualizations to uncover new information. Charts, graphs, tables, and maps are just some of the many visualization options available in Power BI. To create visual representations of your data on the canvas, drag and drop fields from your data there.
Step 8: Refresh Data (Optional)
You might want to set up a schedule for automatic data refresh if your data source is dynamic and frequently updated. Thus, the most recent data will always be displayed in your Power BI reports and dashboards. Depending on your needs, Power BI gives you the option to schedule data updates from a variety of sources.
Power BI’s full potential can only be realised after connecting to a data source, which is the first and most important step. You can easily incorporate your data into Power BI and unlock all of its analysis and visualisation capabilities by following the above-described steps.
Keeping in mind that Power BI supports a wide variety of data sources, you can connect to well-known services like Microsoft Excel, SQL databases, online services, and many more. To make the most of your experience with Power BI, try out a variety of data sources.
Conclusion
Users of Power BI can visualise and analyse data from various sources. It is a strong business intelligence tool. Launching Power BI, selecting “Get Data,” selecting a data source, providing connection information, selecting a data transformation option, selecting a data source, loading the data into Power BI, creating visualisations, and selecting a data refresh option are the steps involved in building a report in Power BI.
Databases, cloud services, online services, files, and more are just a few of the numerous data sources that Power BI supports. Using Power BI, you can connect to an Excel spreadsheet, a SQL Server database, or a web API.
You can easily analyze your data and gain insights to help you make wise business decisions. Connect with Lets Viz, the best BI developer, to analyze your data and build insightful reports using Power BI, Tableau, and Zoho Analytics.