
You should start your business journey to the future today now, by taking the right and thoughtful decisions. When you need to make the right business decisions you need reports and therefore you need reporting. Reporting of different data and metrics, the full statistics and data of everything that can make your business successful or go bankrupt. From small-level reporting to higher-level reporting, you need every person to report to their manager and the managers to the higher-level managers and further, till these reports come to you for final-level decisions. This is where the need for tableau reports for business comes in to help you fully get the whole picture. So, what is tableau and why is it needed to help your business do its best? Do we have to check all the important steps to effectively manage critical business reports in Tableau? Let’s check this out.
World’s No. 1 Analytics Platform
Tableau has been considered the #1 Tableau platform and a fantastic BI tool to assess business needs. This software provides for different businesses to assess their customer’s needs.
As in the year 2021 in the research from the Gartner Magic Quadrant, Tableau was recognized in the consecutive 7th year also as the data reporting leader. This blog will help you with the Tableau and BI reports and how they will enhance your business and make your business successful.
Introduction to Tableau Business Reports in the US

To analyze data you need to measure different types of reports, therefore the data analysis is done through reporting. This also helps in gaining the main data that is in the correct form.
Tableau professional services help in the collection, sorting, and later visualization of data. Firstly, all the raw form data is collected in a centralized place and then further processed to different insights that come from charts, tables, graphs and maps, and others. This helps in making the data in more understandable for different forms. The different styles of tableau reports and dashboards have the ability they can be shared in different styled formats like PDFs, spreadsheets, custom dashboards, PDFs, workbooks, tables, and much more.
How does Tableau Business Reporting Work?
The Tableau reporting work in 4 major steps where you can understand how it’s done and exactly how the Tableau reports that can be done for the process:
First, the data collection is done from the cloud source and from the different data sources. Then the sorting of this data is done as on the dimensions and measures required according to the field data type. When the data sorting is complete, this data is used to form different types of visualizations, that can be in tables, charts, or graphs. Then these BI dashboard features can be shared with other users as well.
This is the basic procedure for the Tableau Reporting work.
Benefits of Tableau Reporting

At last, the final aim of any data report creation is to help the business gather the most valuable insights to help it perform much better and these data-driven ideas can help the business to perform at its highest efficiency. The Tableau is highly enriched with great features that are extremely simple and user-friendly. If you want to know more, here are the detailed benefits of Tableau Reporting and tableau dashboard:
Effortless Reporting
Have no experts in IT? Don’t worry! With just the help of a tableau consultant and further perfecting it, now it’s just a system of dragging and dropping data that makes the interface super simple and easy to use. All the users can easily gather all the data and visualize that data and then can focus on finding the data. Tableau can easily transform the data into proper actionable insights in the form of interactive dashboards.
Speed in marketing
Reporting done within seconds! Through Tableau reports for business, you can easily analyze data. This can help the organizations take decisions quickly and help with the decision process within the organization. This provides a pure competitive edge to businesses that rely on Tableau tools through Tableau report and Tableau
Analysis of Big Data
Tableau’s in-memory system generates dashboards, stories, reports, etc. analytically. This is all done through machine memory to analyze the processing speed of big data.
All data sources are connected
To enhance the power and performance of popular databases, Tableau helps with providing connections that enhance this process. These native-powered connectors help with data sources and help in enhancing security protocols. Using simpler steps of adding data sets from an Excel workbook, database, and other simpler structures along with using the basic fields the tableau does all the data combinations.
Tableau dashboards and Tableau reports example
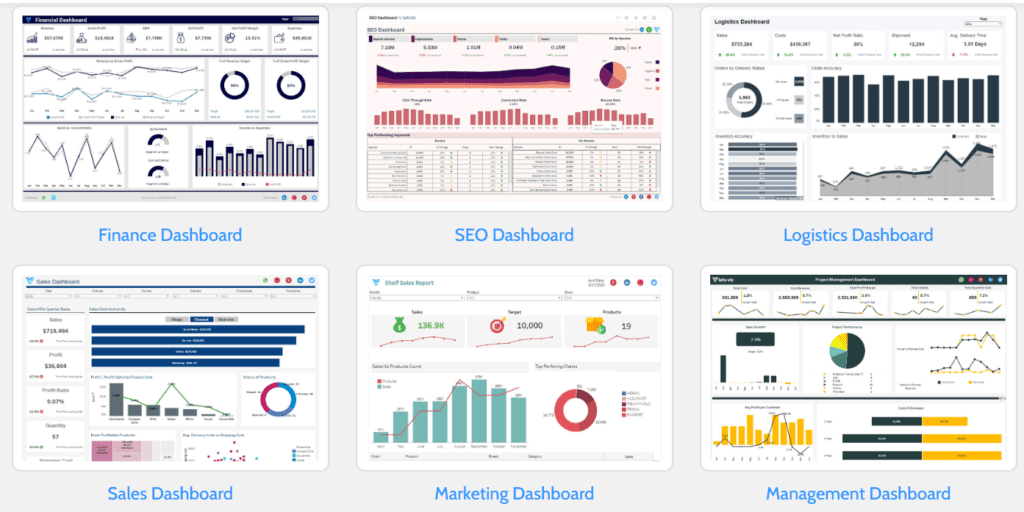
Here are some of the examples of the Tableau reports created by Let’s Viz for effective BI solutions:
(Add images of Tableau Dashboards )
Are you ready to create your own Tableau Dashboard, we have the best tableau expert and tableau professional services at Let’s Viz.
Tableau Business Report Creation: A Step-by-Step Guide
A simple guide on how to create and manage the Tableau Report, full step-by-step procedure:
Step 1: Tableau Worksheet creation
Firstly, you have to get used to the tableau worksheet and all of its core functions. The Tableau worksheet has all the features and tools to create a full-fledged report.
Some of the elements of the Tableau sheet are:
Data Pane – Provides data sources fields
Dimensions Section – Has the dimensional details like Date, Order ID, etc.
Measures Section – Has different fields like profit, quantity, etc.
Rows and Columns – This is used for field and chart creation
Drag & Drop – This is where the chart creation is done
Filters – Application of analysis filters
Pages – Used for seeing previews and placing fields
Data Sources – Manage and join different sources of data
Sheet – Provides for the active sheet
Step 2: Adding Measures and dimensions
Takes the help of Drag & Drop for columns or rows for visual creation.
Step 3: Data visualization
It can be used for making data visualization for business. Using the different tutorials by tableau consultants in the US can help you
Step 4: Dashboard Creation
Here you can use the data to create show data and story using maps, charts, tables, etc.
Simply click on the dashboard tab for dashboard creation. Adding visuals through the sections of the sheet.
Step 5: Sharing dashboard report
Share the dashboard with the others easily.
Tips for managing critical business reports in Tableau:
For getting the most advanced results from the Tableau Dashboard, here are some of the best practices:
You have to understand the objectives, audience plus output and then plan on report creation. The Main report should be easily understood by anybody – Plan on making it simple. You can also consult a Tableau consultant for simplicity. The visualization of data will be interactive along with being attractive and understandable. The report needs to be adapted to the latest technology.
Lets Viz – Tableau Dashboard Solutions in the US
With the most relevant and experienced teams for Tableau reports for businesses in US Let’s Viz will help you grow your business faster and in the most effective way through the most advanced data-driven decisions and strategies by providing the most advanced Tableau expert and Tableau professional services today. Trust Let’s Viz and grow your business today with the best data-driven ideas and insights.