Aggregators in Make: How I Learned to Combine Data Like a Pro

When I first started building scenarios in Make.com, I thought automation was just about moving data from one app to another. But then I discovered aggregators—and suddenly, my workflows went from “just functional” to super efficient.
If you’ve ever needed to group, summarize, or combine data, aggregators are your best friend. They help you take multiple data bundles and merge them into one. Think of them as the secret sauce that makes your automations smarter and cleaner.
In this post, I’ll share what aggregators are, why they matter, and how I’ve used them in real-world scenarios.
What Are Aggregators in Make?
Let’s start with the basics. Aggregation simply means combining multiple values into one.
Here’s an analogy I love:
Imagine you have a pile of bricks.
One brick by itself doesn’t do much.
But stack them together, and you’ve got a wall.
That’s what aggregators do in Make—they take bricks of data (bundles) and combine them into a wall (a single output bundle).
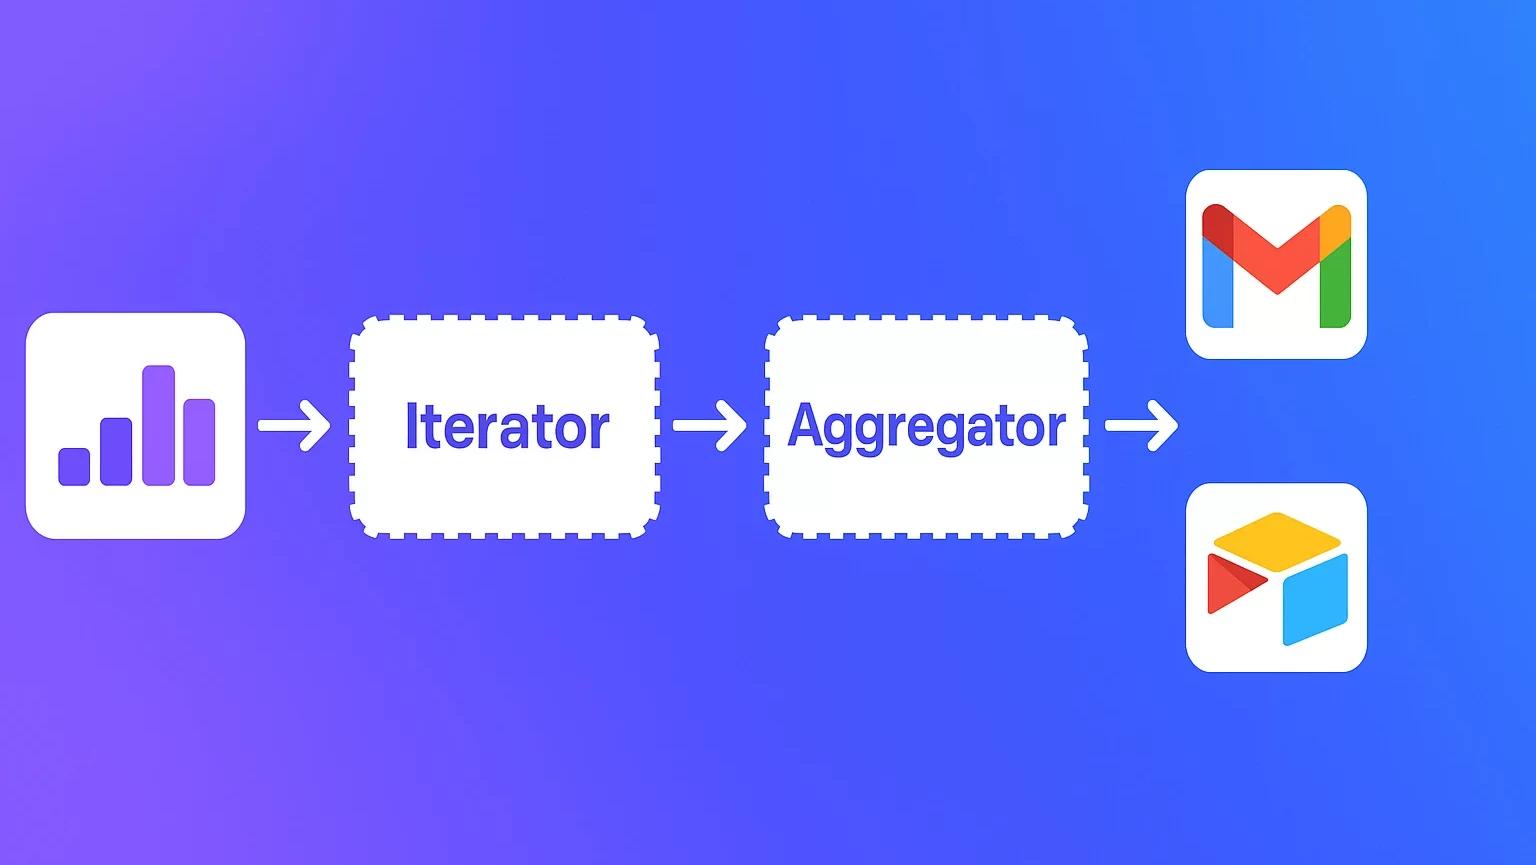
How Aggregators Work: Mapping and Reduction
Behind the scenes, aggregators do two main things:
Mapping → This is where you choose which items you want to use. (In our brick example, it’s like picking only the bricks that aren’t broken.)
Reduction → This is where those items get combined into something new. (Like using cement to actually build the wall.)
That’s aggregation in a nutshell.
Why Are Aggregators Useful?
At first, I thought aggregators were just for combining data. But soon I realized they help me actually understand my data better.
Here’s a simple example:
Imagine a box of colored pencils.
Using an aggregator, I can group them by color and count how many reds, blues, greens, and purples I have.
Now I know:
I have 10 pencils total.
I need to buy more red and blue ones.
I definitely don’t need more purple.
That’s the power of aggregators: not just combining—but using grouped data to make smarter decisions.
Types of Aggregators in Make
Make gives us different flavors of aggregators, depending on the type of data and the result you need.
🔹 Numeric Aggregator
This one’s great for numbers. You can use it to calculate:
SUM → total values (e.g., total expenses).
AVG → averages (e.g., average time spent on tasks).
COUNT → how many items match a rule.
MAX/MIN → highest and lowest values.
Real-life uses I’ve tried:
Time tracking: roll up daily work hours into a weekly or monthly total for invoices.
Social media: sum likes, comments, and shares across multiple platforms.
E-commerce: calculate sales totals across products or countries.
Inventory: track stock levels across different warehouses.
One simple but powerful example:
If each brick weighs 2kg and I used 14 bricks, a SUM aggregator quickly tells me my wall weighs 28kg. Easy!
🔹 Text Aggregator
This one blew my mind the first time I used it. The Text Aggregator collects multiple text items and combines them into one string.
Example scenario I use a lot:
I pull leads from HubSpot or Pipedrive.
Instead of sending one email per lead, I use a Text Aggregator to merge all leads into a single daily summary.
The output looks like:
John Doe – john@example.com
Jane Smith – jane@example.com
Then I send one neat email with the whole list.
You can also:
Choose separators (commas, newlines, custom symbols).
Create lists for reports, dashboards, or Slack notifications.
🔹 Array Aggregator
Now this one is super powerful. The Array Aggregator lets you take fields from multiple bundles and group them into a single structured array.
Here’s a practical example I tried:
One module gave me a list of products from a library.
Another gave me users.
With an Array Aggregator, I merged both into one clean dataset (including magazines, but skipping books).
The cool part? You can customize exactly what fields show up in the output. It’s like building your own dataset from multiple sources.
Aggregate Functions: What You Can Do with Them
Inside the Numeric Aggregator, you’ll find aggregate functions that take your data further:
AVG() → Find average values (like average salary for employees with less than 5 years of experience).
SUM() → Add everything up (like total monthly expenses).
COUNT() → Count how many records meet a condition.
MAX() → Find the highest value (like the largest payment).
MIN() → Find the smallest value (like the lowest invoice amount).
These functions turn raw numbers into insights you can act on.
Why I Love Using Aggregators in My Workflows
When I think back to my first Make scenarios, they were pretty basic. But once I learned aggregators, I started building workflows that actually summarized data, created reports, and revealed patterns.
Instead of dozens of disconnected records, I could generate one clean output—whether that was a:
Daily email digest of leads.
Sales report.
Inventory snapshot.
Engagement summary across platforms.
It feels less like just “moving data” and more like building a system that thinks with me.
Final Thoughts
If you’re new to Make, aggregators might sound intimidating at first—but trust me, once you start experimenting, you’ll see how much time and effort they save.
Start small: try a Text Aggregator to merge data into a list. Then explore Numeric Aggregators for sums and averages. Once you’re ready, dive into Array Aggregators to create custom datasets.
The more you use them, the more you’ll realize that aggregators aren’t just about efficiency—they’re about turning scattered data into actionable insights.
Ready to start building? Sign up for Make.com today and discover the power of agentic automation for yourself.
📩 Contact us today to schedule a free consultation and see how automation can help you keep more customers, protect revenue, and grow stronger.
Check out other helpful Power Automate Blogs

If you are looking forward to getting your data pipeline built and setting up the dashboard for business intelligence, book a call now from here.
#analytics #data #business #artificialintelligence #machinelearning #startup #deeplearning #deeplearning #datascience #ai #growth #dataanalytics #india #datascientist #powerbi #dataanalysis #businessanalytics #businessanalyst #businessandmanagement #dataanalyst #businessanalysis #analyst #analysis #powerbideveloper #powerbidesktop #letsviz