
Forecasting is a technique offered by Tableau, it becomes easy for predicting future values based on the current variation in the data. This technique finds out the current patterns of the data and then measures the future values. The actual value can differ slightly, but the values come nearby to the expected value. Tableau uses a model known as exponential smoothing for forecasting different values.
Apply forecasting to visualization created in Tableau can be easily applied. Follow the steps using an example to add forecasting to visualization-
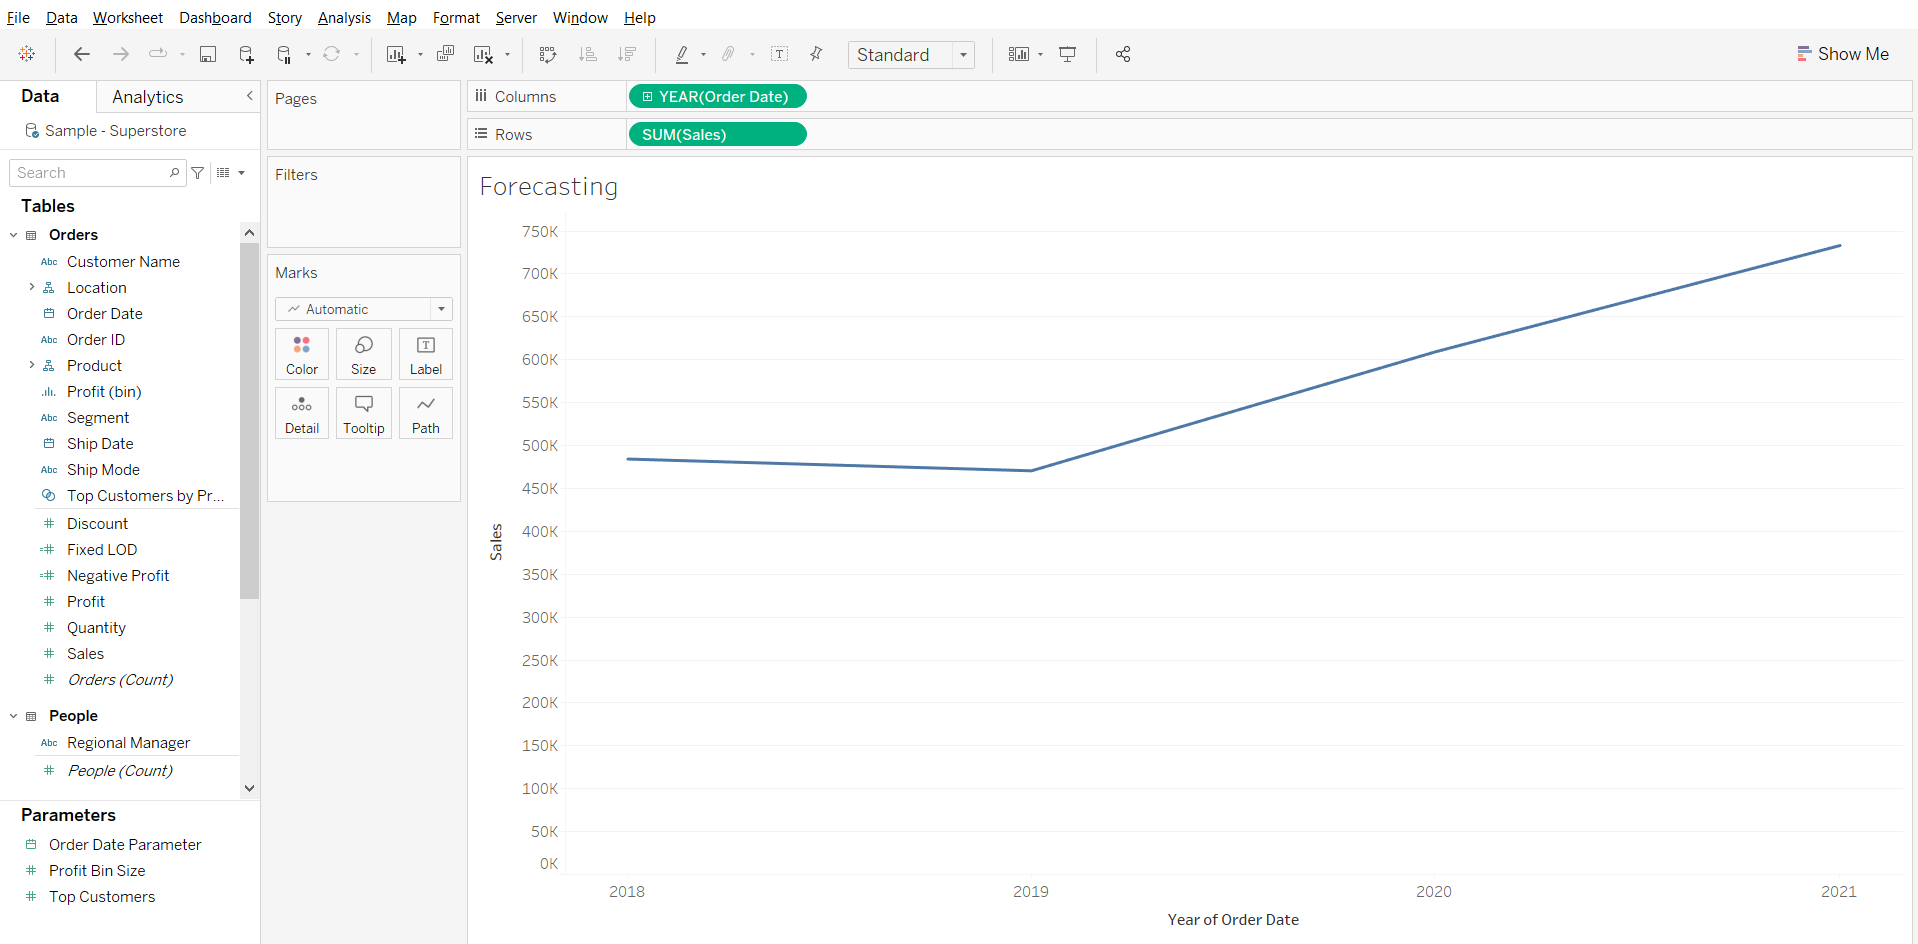
For example – Create visualization for Sales over the year and add forecasting to define the future performance in sales. (Using Sample Superstore)
- Connect to Sample Superstore in Tableau.
- Click on Sheet 1 and Create a Simple visualization using a line chart (Here we have Sales over years).
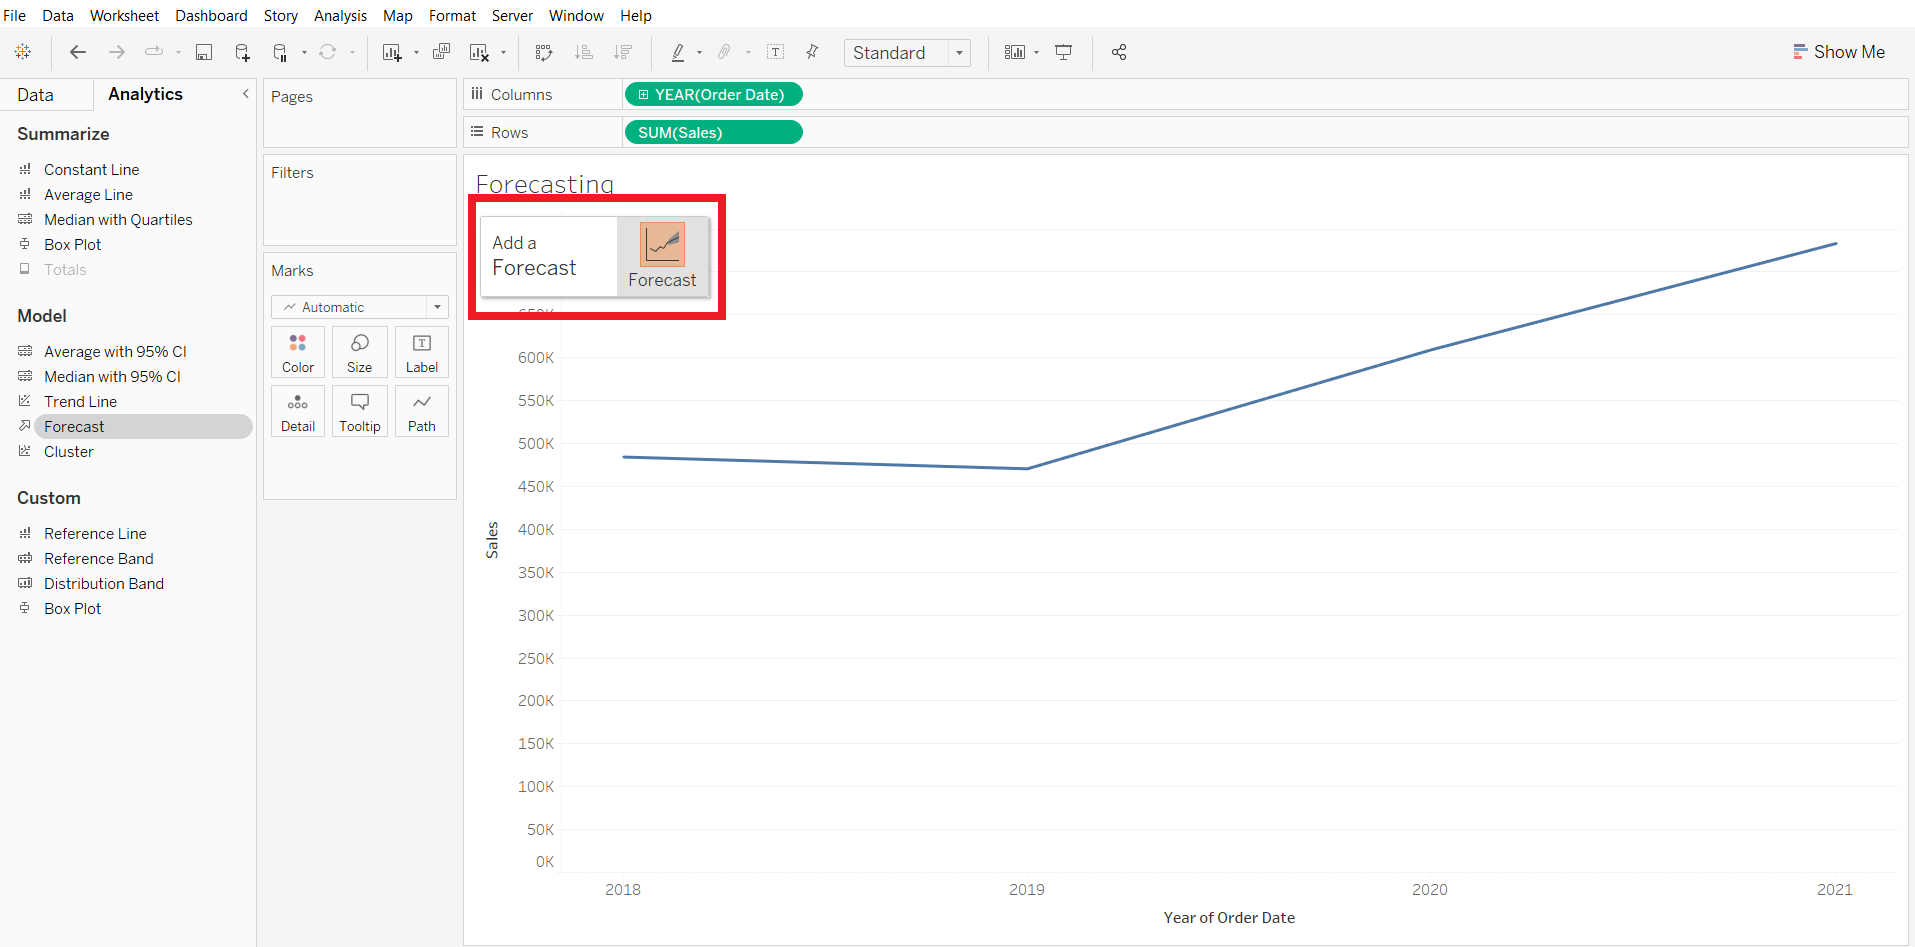
To Add Forecasting –
- Go to the Analysis tab next to the data pane as shown in the following screenshot and Drag Forecast under Model to “Add a Forecast” on visualization.
To Edit Forecasting –
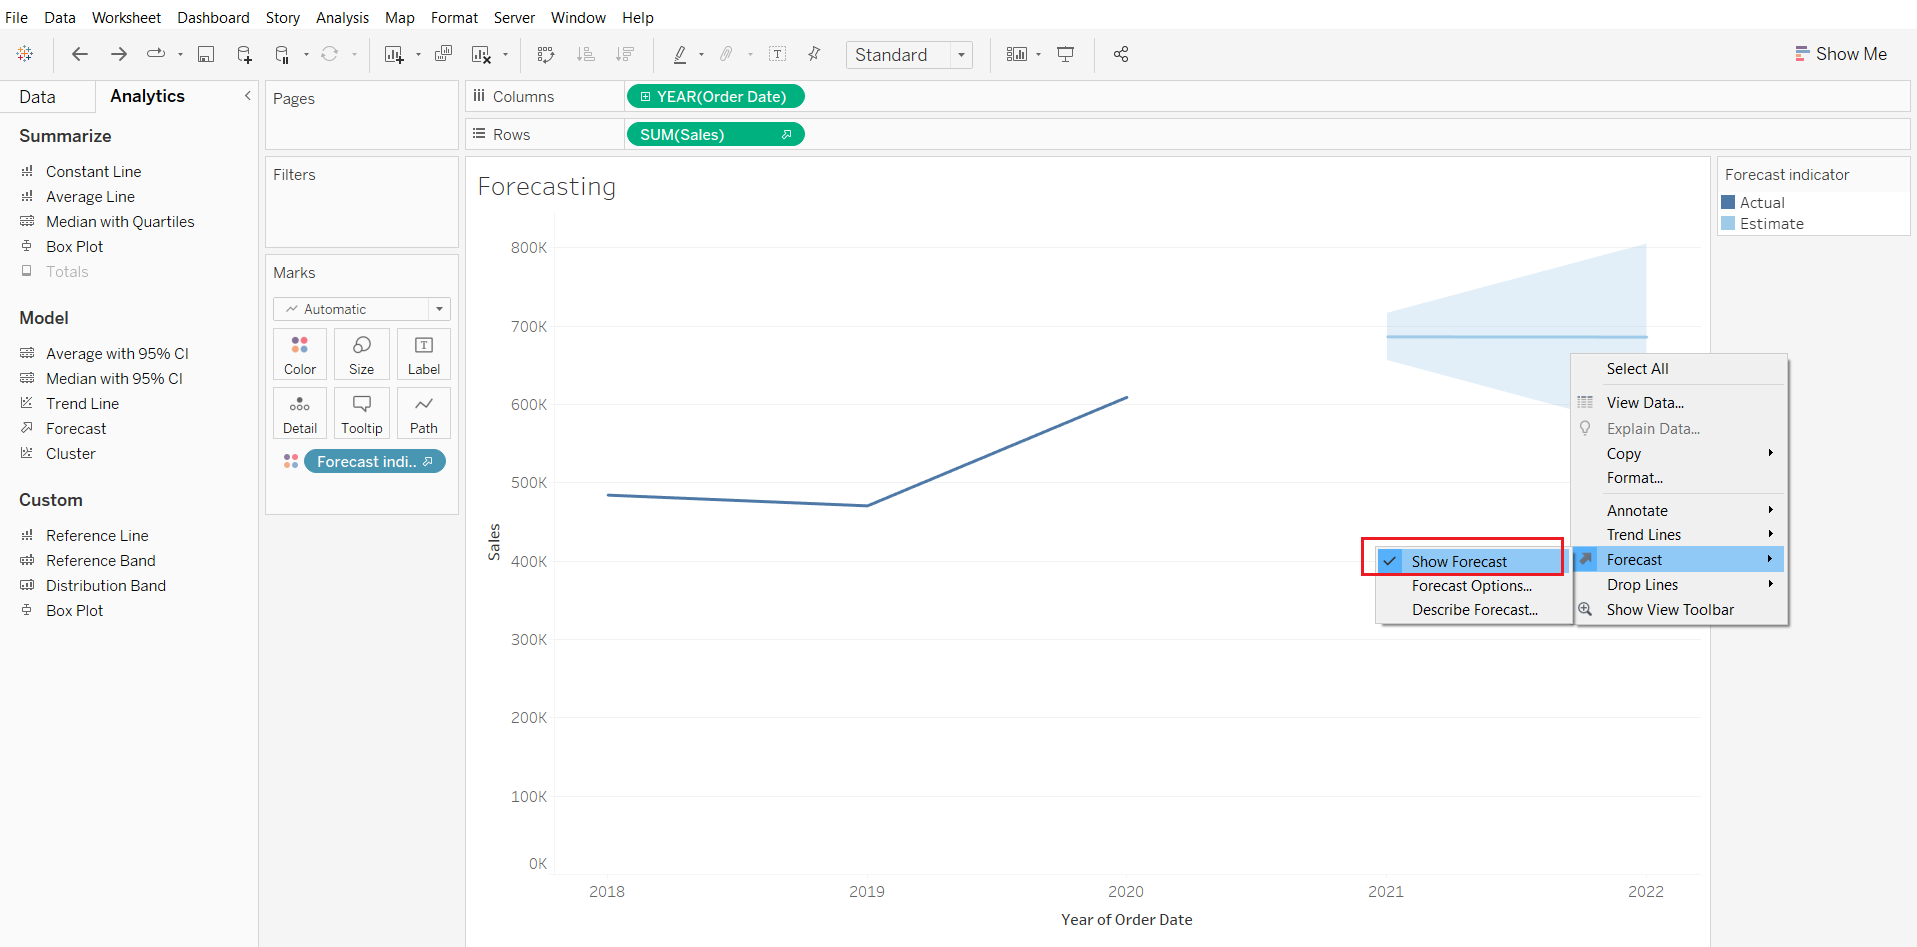
- As we added the forecasting on the visualization, now to edit the visualization, it’s just needed to right-click on the Forecasted range as shown below –
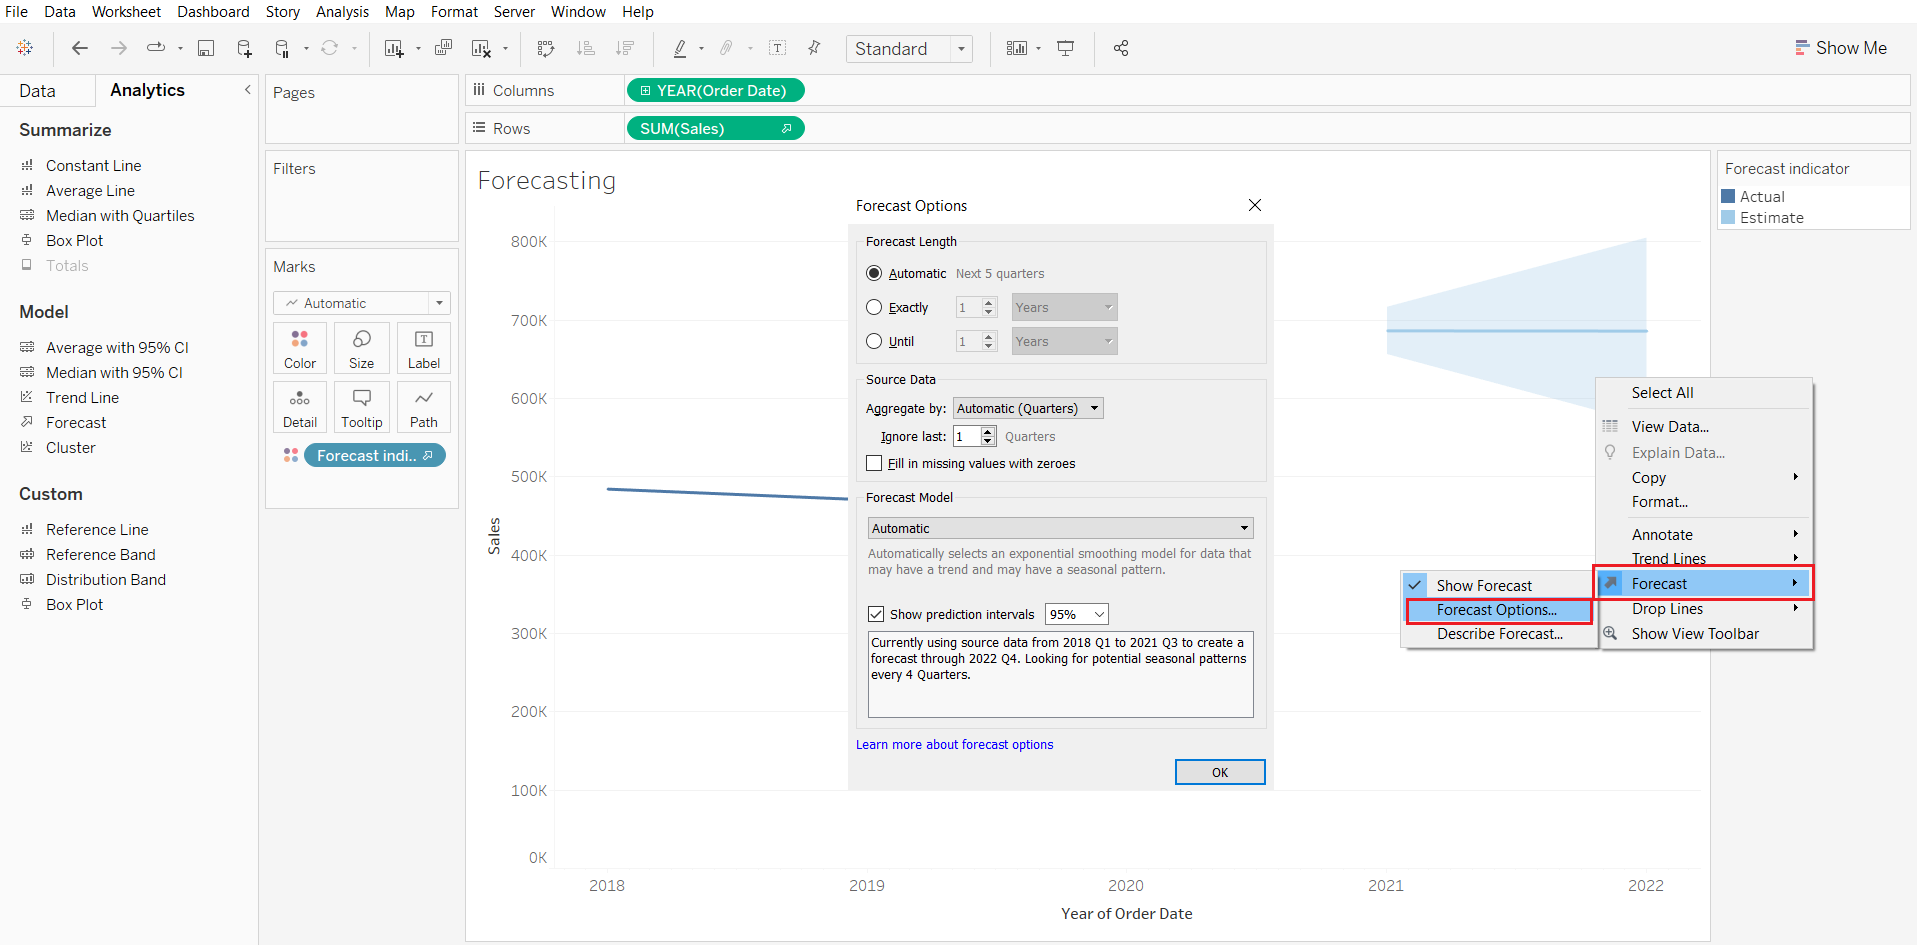
In Forecast, we have different options that can be used to do changes in the forecasting. To edit the forecasting on the measure, Click on “Forecast Options”. A window appeared with the changes that we can continue in forecasting.
To Remove Forecasting –
Removing the forecasting is very easy to perform. Just click on the ‘Show Forecast’ & the forecasted value will be removed.
Follow us on Twitter, Facebook, Linkedin, and Tableau Public to stay updated with our latest blog and what’s new in Tableau.