Sales
Total revenue generated from products or services, indicating demand and business growth.
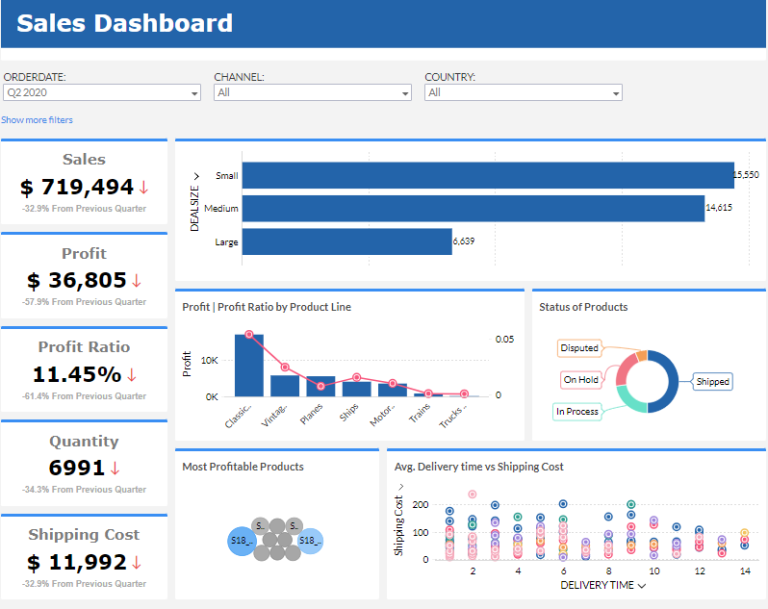
This Sales Dashboard was built in Zoho Analytics to give sales leadership real-time visibility into revenue, profit, product performance, shipping cost, and delivery time — all in one place. We design and deploy these dashboards directly inside your Zoho environment so your team doesn’t have to stitch reports in Excel every week. Want a dashboard like this for your team? Work with our Zoho consulting team and we’ll build and automate it for you in under 30 days.
Track sales, quantity, profit, shipping cost, and profit ratios in one Zoho Analytics dashboard view.
Built in Zoho Analytics with live sales KPI tracking and profitability drill-down analysis.
Explore the core Zoho Analytics sales dashboard views built for revenue and profitability decisions.
Interactive Zoho Analytics sales reporting view.
Open the live embedded Zoho Analytics sales dashboard directly in a fullscreen modal.
Track sales, quantity, profit, shipping cost, and product-line profitability in one place.
Total revenue generated from products or services, indicating demand and business growth.
Total number of units sold, indicating product demand and sales volume.
Total earnings after deducting all expenses, reflecting the financial success and sustainability of the business.
Total expenses incurred for shipping products to customers, impacting overall profitability.
Percentage of profit relative to sales, measuring the efficiency of revenue generation and cost management.
Profit margin segmented by different product categories, helping identify the most profitable lines and optimize product strategy.
These are the practical sales challenges this dashboard helps teams resolve.
Sales dashboards provide a unified view of sales data, ensuring consistent insights across the entire team, eliminating discrepancies that can hinder decision-making.
Sales Dashboard , advanced data visualization tools help identify patterns in sales trends, allowing businesses to quickly adapt their strategies based on insights.
It enables users to customize dashboards to meet specific needs, ensuring that sales data is presented in the most meaningful and actionable way possible.
Sales Dashboard provides real-time insights into sales, profit, and profit ratios, enabling businesses to track profitability over time. This helps identify whether profit margins are increasing or decreasing and what actions need to be taken.
Sales Dashboard integrates key metrics such as Sales Volume, Profit, and Profit Ratio, giving businesses a clear view of sales effectiveness. Teams can identify if increased sales are translating to increased profits or if sales volume is being driven by low-margin products.
Sales Dashboard helps segment customers based on shipping costs and product quantity, making it easier to identify customer segments where shipping costs are particularly high or profits are lower, enabling businesses to adjust strategies accordingly.
Key Details
Key Zoho sales dashboard capabilities with context from the source page.
A sales dashboard represents sales data in one analytical layout so teams can monitor key indicators from a single page.
You can track sales, profit, profit ratio, quantity, and shipping costs in one place to understand business performance clearly.
Sales distribution and KPI trends can be monitored over time, helping teams evaluate what is working and where action is needed.
Clear visual summaries help organizations simplify reporting and optimize sales strategy based on actionable insights.
How this dashboard helps sales teams move from fragmented Zoho reporting to faster, profit-aware decisions.
Sales teams often struggle with scattered metrics, delayed trend visibility, and low confidence in profitability tracking across Zoho reports.
This dashboard centralizes sales and profitability KPIs in one Zoho Analytics view for faster commercial decisions.
Find answers to common questions about this Zoho sales dashboard.
It gives a single live view of sales, quantity, profit, shipping cost, and profit ratio to support faster decisions.
We’re Zoho Analytics consultants. We build sales dashboards like this, wire them into your actual data, and automate weekly reporting so your sales head, operations team, and finance lead are all looking at the same truth — without manual Excel work.
NDA-safeNo obligationClear next steps
This page was seeded from WordPress + Yoast data and mapped to your Sanity dashboard schema.