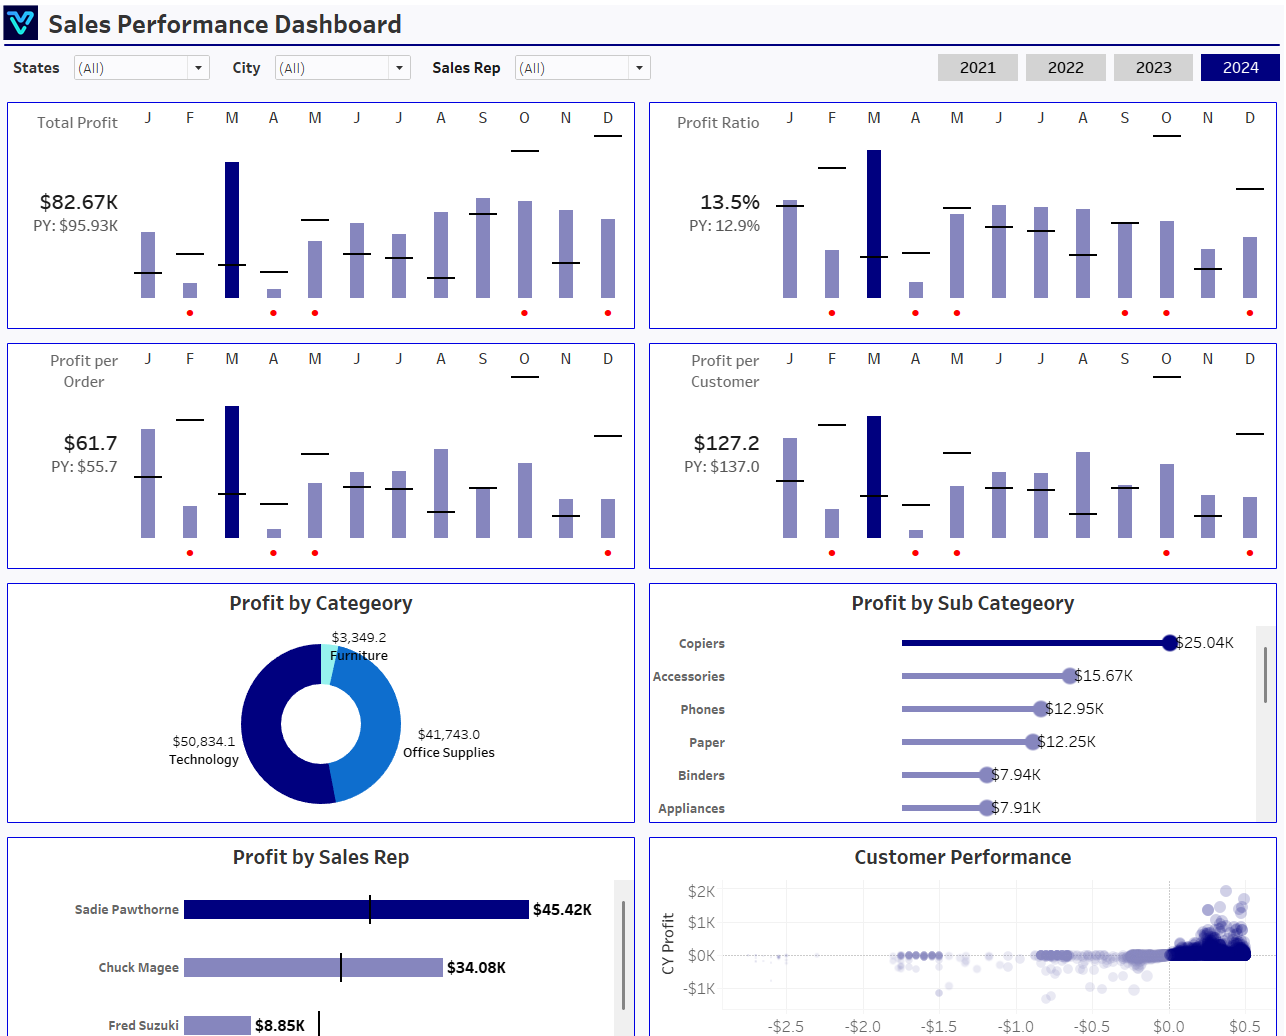
Featured Dashboard

Sales Performance Dashboard

Unlock the power of seamless sales management with our Sales Performance Dashboard! Dive into a world of real-time insights, where every sale, every detail counts. Track revenue, identify trends, and optimize your sales strategies for increased efficiency, higher conversions, and delighted customers.

Track the most important business KPIs in one interactive decision-ready dashboard.

Built with modern analytics tooling and business-ready KPI tracking.

Dashboard hero image
See It in Action

Explore Dashboard Screens

Explore the core dashboard views designed for practical day-to-day reporting.

View 1 of 1

Live Dashboard

Interactive reporting view.

Live Dashboard Experience

Open the live embedded finance dashboard directly in a fullscreen modal.

Dashboard preview
Key Performance Indicator Trends and Insights

Key Performance Indicators

Track the most important performance indicators needed for faster business decisions.

Total Profit

The Total Profit metric represents the overall profit generated by your sales activities over a specific period. It is calculated by subtracting the total costs (such as production, shipping, and other expenses) from the total sales revenue.

Profit per Customer

This KPI measures the average profit earned from each customer. It provides insights into customer value and helps sales teams identify which customer segments are the most profitable, guiding targeted marketing and sales strategies.

Profit Ratio

This KPI indicates the percentage of sales revenue that is turned into profit. A higher profit ratio signifies better cost management and higher profitability, while a lower ratio may signal issues with pricing, costs, or efficiency.

Profit per Order

This metric indicates the average profit generated from each sale or order. A high profit per order suggests efficient pricing and product selection, while a low value might indicate the need for adjustments.

Problems We Solve

What This Dashboard Helps You Fix

These are the practical challenges this dashboard is built to solve.

Fragmented reporting

Data spread across tools creates delays and misalignment.

Limited KPI visibility

Teams miss trends without a consolidated dashboard view.

Key Details

Dashboard Key Points

All major dashboard points summarized as concise bullets.

  • Total Profit

  • Profit per Customer

  • Profit Ratio

  • Profit per Order

From challenge to success

The Problem, Our Approach & Results

How this dashboard helps teams move from fragmented reporting to faster decisions.

The challenge

Finance teams often struggle with delayed reporting, fragmented sources, and low confidence in KPI consistency.

Our approach

This dashboard centralizes financial metrics in one view with real-time updates and consistent definitions.

What we achieved

Created a single source of truth for critical KPIs.
Improved reporting speed and cross-team visibility.
Enabled faster, data-backed decision making.
Reduced manual effort through centralized reporting workflows.
Results verifiedExplore this dashboard
Audience

Who This Dashboard Is For

Ideal For

  • Teams that need unified KPI visibility
  • Decision-makers requiring faster reporting

Not Ideal For

  • Teams looking for static one-off reports only
  • Organizations without consistent data tracking

Frequently Asked Questions

Find answers to common questions about this finance dashboard.

The Total Profit metric represents the overall profit generated by your sales activities over a specific period. It is calculated by subtracting the total costs (such as production, shipping, and other expenses) from the total sales revenue. This figure helps sales managers and executives assess the overall financial health of the sales operation.

Dashboard background

Helping companies make data-driven decisions to achieve their Goals

Experience superior data analysis with our custom dashboards. Specializing in all tools and technologies, we turn data into visually compelling, actionable insights

Get in Touch

NDA-safeNo obligationClear next steps

This page was seeded from WordPress + Yoast data and mapped to your Sanity dashboard schema.