Lead Volume
Monitored live in dashboard with regular performance checks.
Discover actionable insights through an interactive business dashboard.
Track lead volume, source performance, conversion rate, pipeline velocity, and cost per lead in one Power BI view.
Built in Power BI for lead-focused teams with unified volume, source, and conversion tracking.
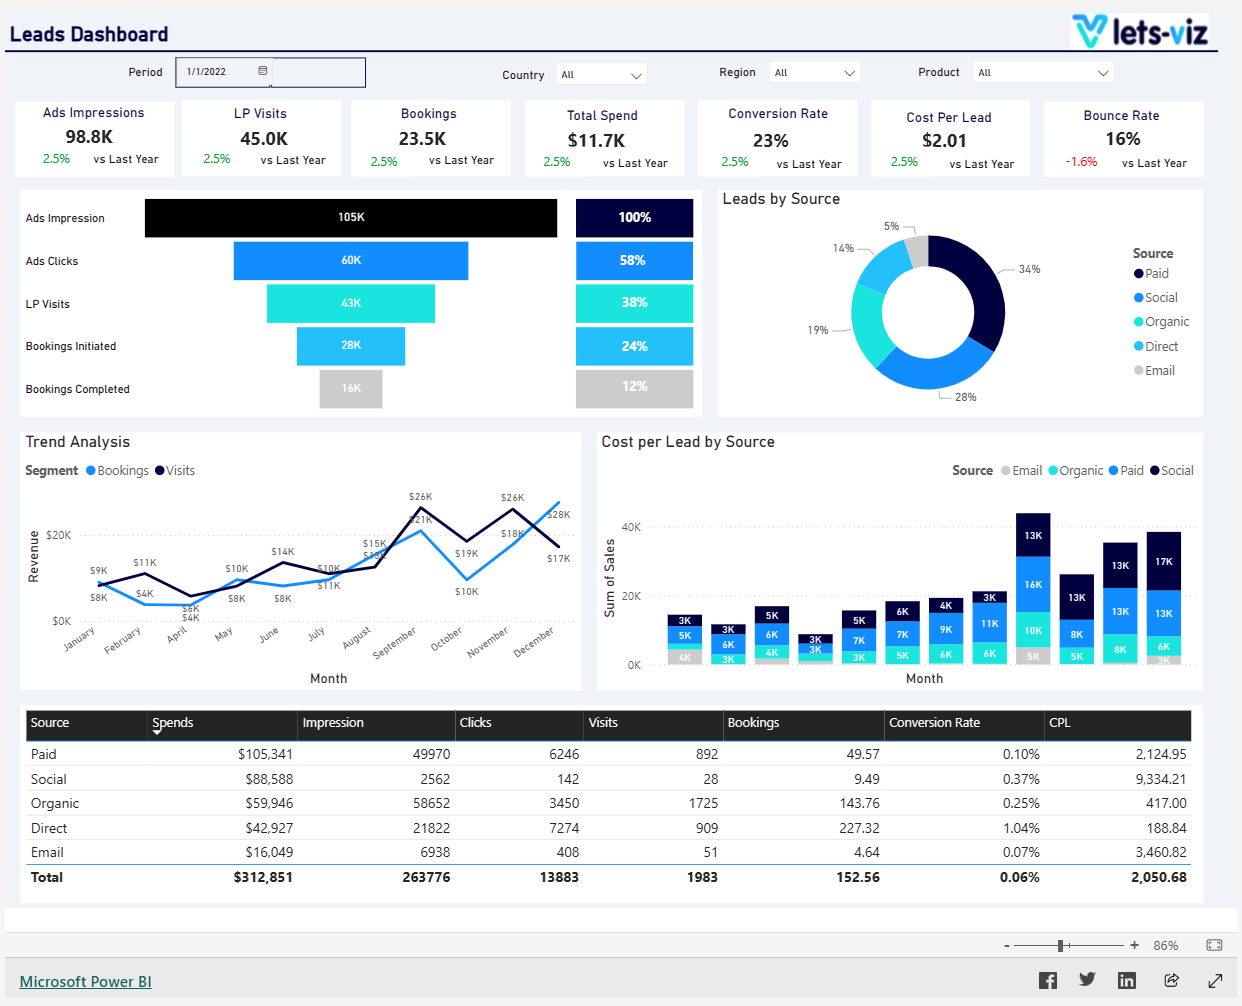
Explore the core Power BI leads dashboard views built for lead generation and conversion decisions.
Interactive Power BI leads reporting view.
Open the live embedded Power BI leads dashboard directly in a fullscreen modal.
Track lead volume, conversion rate, source performance, cost per lead, and pipeline movement in one decision-ready view.
Monitored live in dashboard with regular performance checks.
Tracked against previous period to identify trend movement.
Track conversion efficiency to improve funnel performance and decision speed.
Monitor cost movement over time to improve efficiency and budget control.
Tracked against previous period to identify trend movement.
Used as a decision KPI for weekly performance reviews.
These are the lead generation and pipeline visibility challenges this dashboard helps teams resolve.
When lead data is scattered across tools, teams struggle to understand volume, quality, and conversion trends quickly.
Without a unified view, it is difficult to see which channels and campaigns generate the most qualified leads.
Teams need visibility into lead-to-opportunity and lead-to-customer conversion rates to optimize follow-up.
CPL and spend metrics are harder to monitor when reporting is manual or delayed.
A shared leads dashboard helps sales and marketing teams review the same KPIs and improve handoffs.
Centralized reporting reduces spreadsheet work and speeds up lead performance reviews.
Key Details
Key leads dashboard capabilities with context from the source page.
See lead volume, qualification rate, and pipeline movement in one Power BI view.
Identify which channels, campaigns, or forms generate the strongest leads.
Track lead-to-opportunity and lead-to-customer conversion rates over time.
Measure CPL alongside volume and conversion to optimize spend.
How this dashboard helps sales and marketing teams move from fragmented lead reporting to faster conversion decisions.
Marketing and sales teams often struggle with fragmented lead reporting, delayed visibility into source performance, and low confidence in lead-to-pipeline conversion trends.
This dashboard centralizes lead volume, source performance, conversion rate, and pipeline velocity KPIs in one Power BI view for faster lead decisions.
Find answers to common questions about this leads dashboard.
It consolidates lead generation and conversion KPIs into one Power BI view so teams can monitor volume, quality, and pipeline trends in one place.

Get a custom Power BI leads dashboard built around your lead volume, conversion, and pipeline goals.
NDA-safeNo obligationClear next steps
This page was seeded from WordPress + Yoast data and mapped to your Sanity dashboard schema.