Revenue
Monitor total store revenue movement to detect growth and decline faster.
Struggling to keep track of your Shopify store’s performance across various platforms? Feeling overwhelmed by scattered data and unsure where to focus your optimization efforts? You’re not alone. Many Shopify store owners face the challenge of managing diverse data points, hindering their ability to make informed decisions.
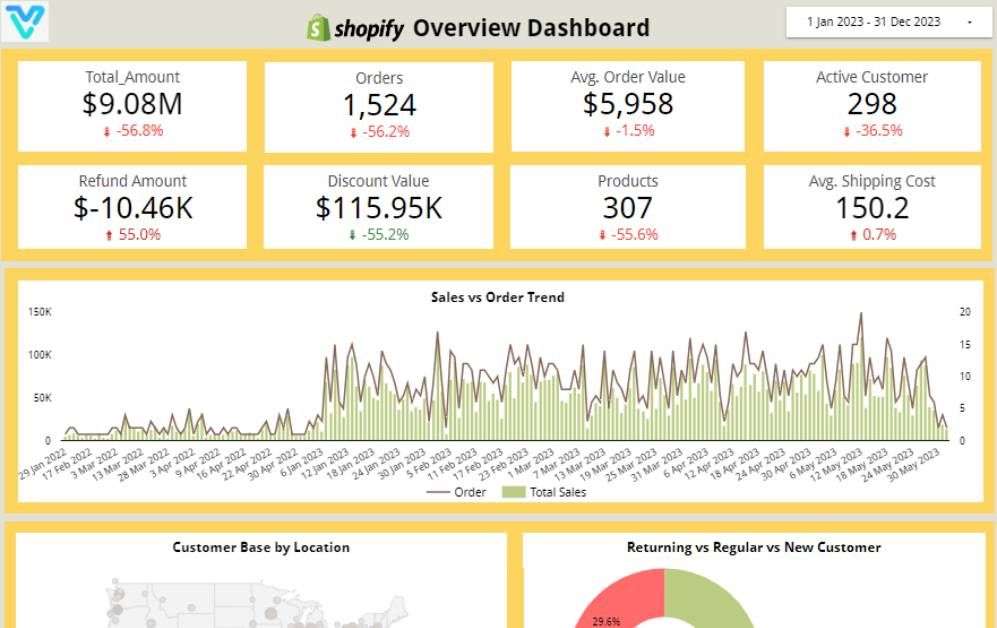
Track Shopify revenue, orders, average order value, conversion rate, returning customers, and channel performance in one live Looker Studio view.
Built in Looker Studio with Shopify KPI tracking for revenue, orders, average order value, conversion rate, and customer trends.
Explore the core Looker Studio Shopify performance dashboard views built for ecommerce and growth decisions.
Interactive Looker Studio Shopify ecommerce reporting view.
Open the live embedded Looker Studio Shopify performance dashboard directly in a fullscreen modal.
Track revenue, orders, AOV, conversion rate, returning customers, and channel-level ecommerce KPIs in one Looker Studio view.
Monitor total store revenue movement to detect growth and decline faster.
Track order volume trends to validate demand shifts and campaign impact.
Track order volume trends to validate demand shifts and campaign impact.
Measure checkout efficiency from traffic to purchase and spot friction early.
Track repeat-buyer behavior to assess retention and customer lifetime momentum.
Compare channel contribution to prioritize traffic sources with stronger purchase intent.
These are the practical Shopify reporting challenges this dashboard helps teams resolve.
Teams lose speed and clarity when Shopify revenue, order, product, and channel data are split across disconnected reports.
Without centralized KPI tracking, drops in conversion rate, AOV, or order volume are identified late and optimization cycles slow down.
It becomes harder to prioritize merchandising and inventory decisions when product-level revenue and conversion trends are not unified in one view.
Comparing performance across paid, organic, and referral channels is difficult when definitions and reporting views differ by source.
Frequent exports and spreadsheet stitching consume time and introduce errors, reducing bandwidth for growth-focused analysis.
Teams struggle to monitor returning customer behavior, retention signals, and purchase patterns when lifecycle metrics are not centralized.
Key Details
Key Looker Studio Shopify dashboard capabilities with context from the source page.
How this dashboard helps ecommerce teams move from fragmented Shopify reports to faster, data-backed growth and merchandising decisions.
Ecommerce teams often struggle with fragmented Shopify reporting, delayed visibility into revenue and conversion shifts, and low confidence in channel and product performance analysis.
This Looker Studio dashboard centralizes Shopify revenue, orders, average order value, conversion rate, and channel performance in one view for faster ecommerce decisions.
Find answers to common questions about this Looker Studio Shopify performance dashboard.
It is an interactive reporting layer that visualizes Shopify KPIs such as revenue, orders, average order value, conversion rate, and customer trends in one place.
Get a custom Looker Studio Shopify dashboard built around your ecommerce reporting, merchandising, and growth workflows.
NDA-safeNo obligationClear next steps
This page was seeded from WordPress + Yoast data and mapped to your Sanity dashboard schema.