Impressions
Total number of times your content is displayed on LinkedIn, regardless of clicks or interactions.
Drive better results with our LinkedIn performance dashboard. Get actionable insights on engagement, audience demographics, and content reach to improve your social strategy.
Track impressions, clicks, CTR, spend, leads, and campaign performance in one Looker reporting view.
Built for LinkedIn marketing teams with centralized KPI tracking and campaign drill-down visibility.
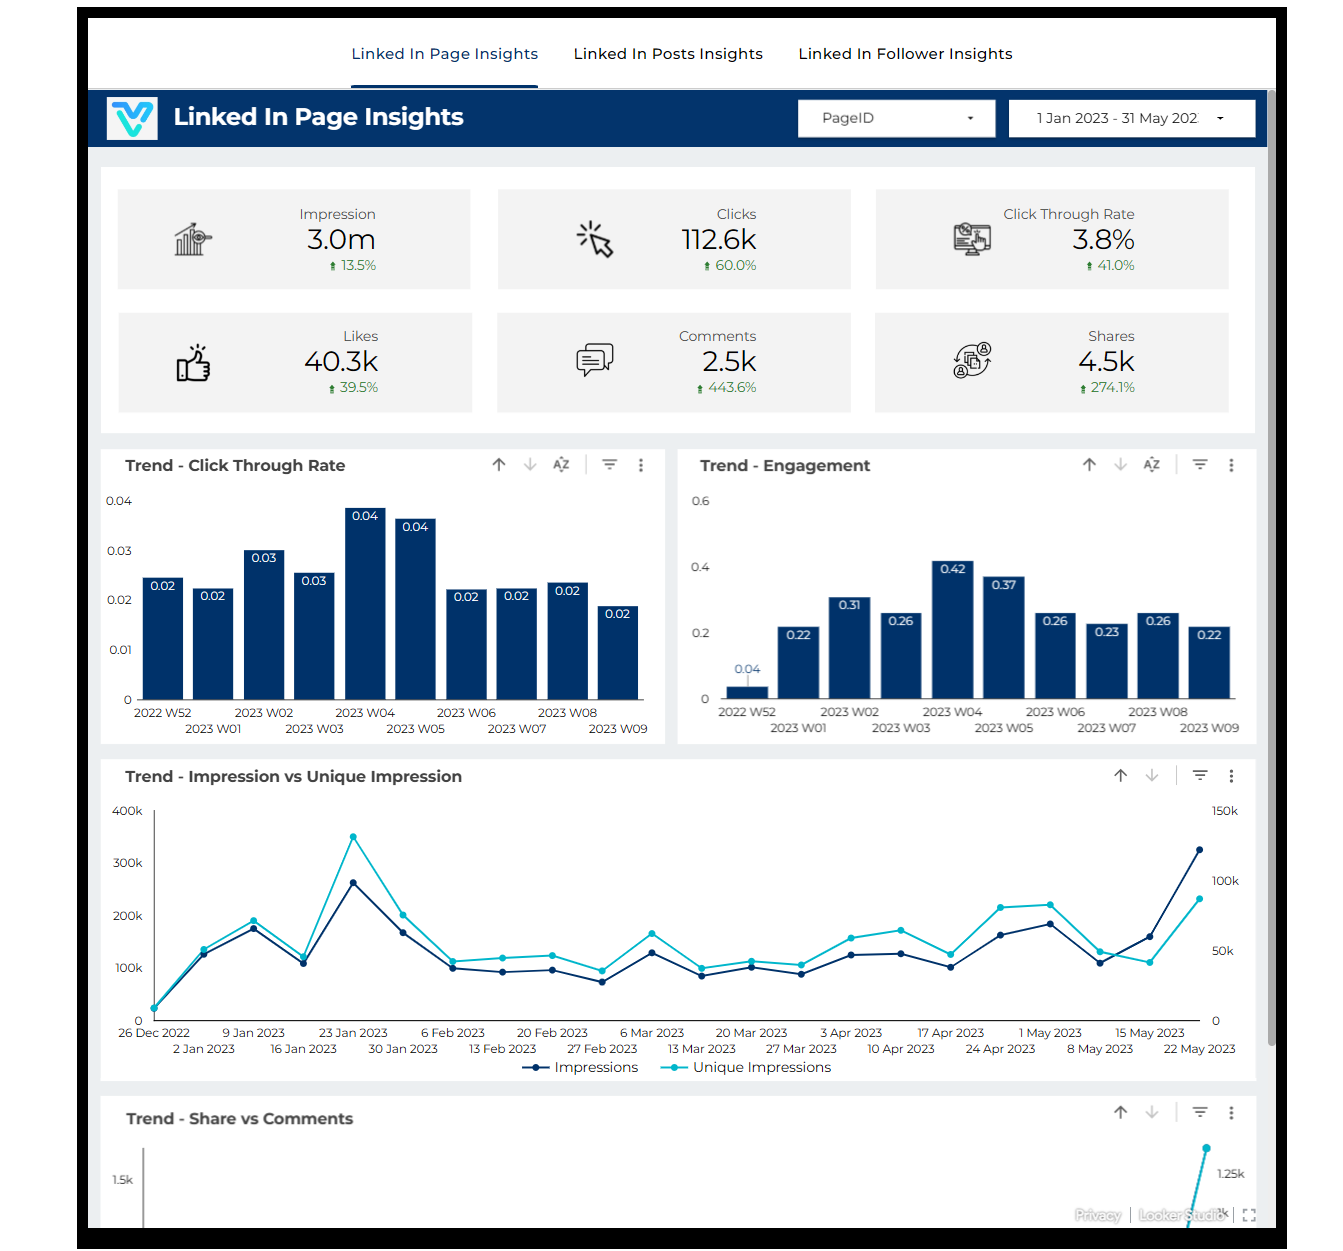
Explore the core LinkedIn performance analytics views built for campaign and leadership decisions.
Interactive LinkedIn performance analytics reporting view.
Open the live embedded finance dashboard directly in a fullscreen modal.
Track impressions, clicks, CTR, spend, conversions, and efficiency KPIs in one decision-ready view.
Total number of times your content is displayed on LinkedIn, regardless of clicks or interactions.
The total number of comments on your posts, showing the level of conversation and user interaction.
The total number of clicks on your content, links, or profile, indicating user engagement and interest. .
The total number of times your content is shared, indicating the reach and virality of your posts.
The percentage of people who click your content compared to the number of impressions, reflecting content effectiveness.
The number of followers gained through non-paid efforts, reflecting natural growth and audience interest.
The total number of likes on your posts, representing engagement and audience appreciation.
The number of followers acquired through paid advertising campaigns, reflecting the impact of paid strategies.
These are the practical LinkedIn performance reporting challenges this dashboard helps teams resolve.
When KPIs are spread across exports and tools, teams lose a unified view of what is driving outcomes.
Delayed visibility into clicks, CTR, and lead trends slows iterative improvements across campaigns.
A centralized dashboard makes it easier to track CPL and efficiency shifts and reallocate budget faster.
How this dashboard helps marketing teams move from fragmented LinkedIn reporting to faster campaign decisions.
Finance teams often struggle with delayed reporting, fragmented sources, and low confidence in KPI consistency.
This dashboard centralizes financial metrics in one view with real-time updates and consistent definitions.
Find answers to common questions about this finance dashboard.
It consolidates key LinkedIn campaign KPIs into one reporting view so teams can monitor performance and make faster optimization decisions.

Experience superior data analysis with our custom dashboards. Specializing in all tools and technologies, we turn data into visually compelling, actionable insights
NDA-safeNo obligationClear next steps
This page was seeded from WordPress + Yoast data and mapped to your Sanity dashboard schema.